Paved Inequity: How Cities Choose Which Neighborhoods Get Fixed First—and What Residents Can Do to Shift the Balance
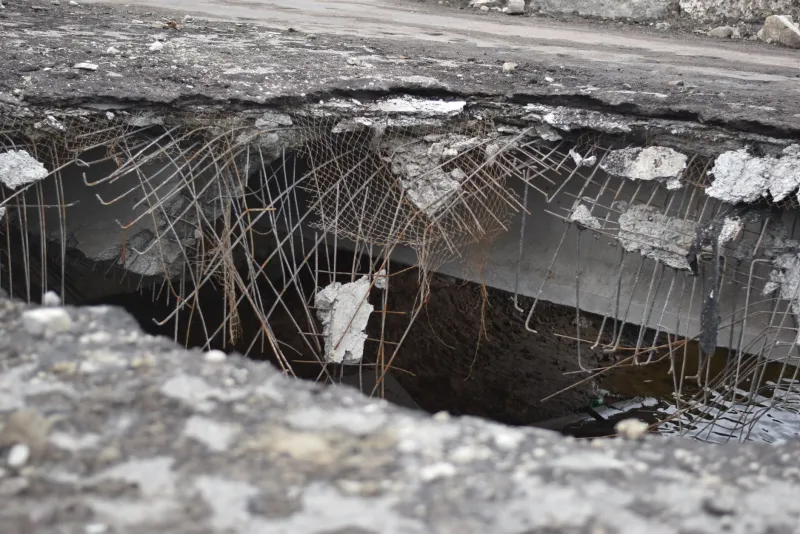
Drive through almost any mid-sized American city and the contrast becomes unmistakable within a matter of blocks. Freshly sealed asphalt gives way to fractured pavement, sunken curbs, and utility patches that have been repaired so many times the original road surface is barely visible beneath layers of temporary fixes. The divide is rarely random. In city after city, the neighborhoods that wait longest for repairs share recognizable characteristics—lower median incomes, higher proportions of residents of color, and fewer elected officials who owe them a political debt.
Municipalities rarely advertise this reality. Instead, public works departments present repair schedules wrapped in the language of engineering objectivity: pavement condition indices, asset management software, cost-per-lane-mile calculations. The terminology is real, and the tools are legitimate. But the inputs that feed those systems—which streets get inspected, how frequently, and how scores translate into funding priority—are shaped by decisions that carry unmistakable human fingerprints.
The Mechanics of a Biased System
Most cities rely on a Pavement Condition Index, or PCI, to rank road quality on a scale from zero to one hundred. Streets below a certain threshold are theoretically prioritized for repair. In practice, however, PCI scores are only as reliable as the inspection process that generates them. Cities with limited inspection budgets tend to survey arterial roads and major corridors more frequently than residential side streets. High-traffic commercial zones accumulate more data points, which means they surface more consistently in repair queues.
Residential streets in lower-income neighborhoods often go years between formal assessments. A road with a genuine PCI of 35 that has never been formally scored effectively does not exist inside the city's asset management system. It cannot compete for funding it has never been entered to receive.
Beyond the inspection gap, there is the question of what triggers a repair request in the first place. Cities that rely heavily on resident-submitted complaints to supplement their inspection data inadvertently disadvantage communities with lower rates of digital access, less familiarity with 311 systems, or historical reasons to distrust government responsiveness. Complaints that go unanswered for months teach residents that reporting is futile. Silence is then interpreted by city systems as an absence of need.
Political Geography and the Repair Calendar
Engineering scores do not exist in a vacuum. Capital improvement budgets pass through city councils, and council members are not passive observers of the allocation process. In cities with district-based representation, elected officials routinely advocate for repair projects in their wards—a practice that is entirely legal and, to many, an expected part of the job. The problem emerges when advocacy capacity is distributed unequally.
Districts with organized neighborhood associations, active constituent contact, and council members with seniority or committee assignments tend to extract a disproportionate share of repair funding relative to their road conditions. Districts with fragmented civic infrastructure, high residential turnover, or representatives who lack political leverage often see their infrastructure requests deprioritized or deferred year after year. The result is a repair calendar that mirrors the city's political map as much as its engineering data.
Some cities have compounded this dynamic through the use of matching funds or cost-share programs, in which neighborhoods that raise private contributions unlock additional public investment. While framed as innovative public-private collaboration, such mechanisms effectively reward communities with existing wealth and penalize those without the organizational or financial capacity to participate.
Reading the Data Your City Already Publishes
The good news is that the evidence needed to document these disparities is frequently available to the public—it simply requires knowing where to look and how to read it.
Begin with your city's capital improvement plan, or CIP. Most municipalities are required to publish this document annually, and it lists planned infrastructure projects alongside their estimated costs and funding sources. Download the most recent three to five years of CIP data, identify all road repair and resurfacing projects, and map them by neighborhood or census tract. Free tools such as Google My Maps, Tableau Public, or even a well-organized spreadsheet can make geographic patterns visible within hours.
Next, request pavement condition data through your city's open data portal or via a formal public records request. Ask specifically for PCI scores by street segment, the date of the most recent inspection for each segment, and the methodology used to prioritize projects in the current budget cycle. If your city uses a private asset management vendor—common names in this space include Cartegraph, CityWorks, and Esri-based systems—the underlying data remains a public record even if the software is proprietary.
Once you have both datasets, compare neighborhoods with similar or worse pavement scores that received repair funding against those that did not. Look for patterns across income levels, racial demographics, and council district boundaries. This comparison is the foundation of an evidence-based advocacy argument.
Building Pressure That Produces Results
Data alone rarely moves institutions. The communities that have successfully shifted repair allocation patterns in cities including Memphis, Kansas City, and Fresno have combined rigorous documentation with sustained, visible public pressure.
Start by presenting your findings to your city council representative directly—not through a public comment period, but in a scheduled constituent meeting where a response is expected. Bring a one-page summary of your analysis, a map, and a specific ask: not merely that repairs happen, but that the city adopt or publish a transparent, equity-weighted prioritization formula.
If that meeting produces no commitment, expand your coalition. Neighborhood associations, faith communities, local NAACP chapters, and small business groups that operate on affected streets all have standing to amplify the issue. A joint letter signed by ten organizations carries significantly more institutional weight than a petition signed by a thousand individuals.
Consider requesting a formal audit of the city's repair prioritization methodology through the office of the city auditor or inspector general, if one exists. Several cities have produced internal audit reports on infrastructure equity in recent years, and those reports have served as the basis for policy reforms that embedded equity criteria directly into the capital planning process.
Finally, engage local journalists. Infrastructure equity is a story with visual evidence, quantifiable disparities, and a direct impact on daily life—precisely the kind of reporting that regional outlets can pursue effectively. A well-documented data package handed to a reporter reduces the research burden and increases the likelihood of publication.
What Equitable Infrastructure Policy Actually Looks Like
A growing number of cities are adopting explicit equity overlays in their infrastructure planning processes. Los Angeles, Seattle, and Boston have each developed frameworks that weight repair priority scores by socioeconomic indicators, directing additional resources toward historically underinvested communities even when PCI scores are comparable to wealthier areas.
These frameworks are not charity. They reflect a recognition that deferred maintenance in low-income neighborhoods generates compounding costs—vehicle damage, emergency repairs, and economic disinvestment—that ultimately burden the entire city's budget. Equitable infrastructure policy is, in most cases, also fiscally rational infrastructure policy.
Residents who understand how their city's repair system operates are positioned to demand that rationality. The data is there. The tools are accessible. And the communities that have organized around this issue have demonstrated, repeatedly, that cities do respond when the pressure is sustained and the evidence is clear.
Your street's condition is not a matter of luck. It is a matter of policy—and policy can be changed.